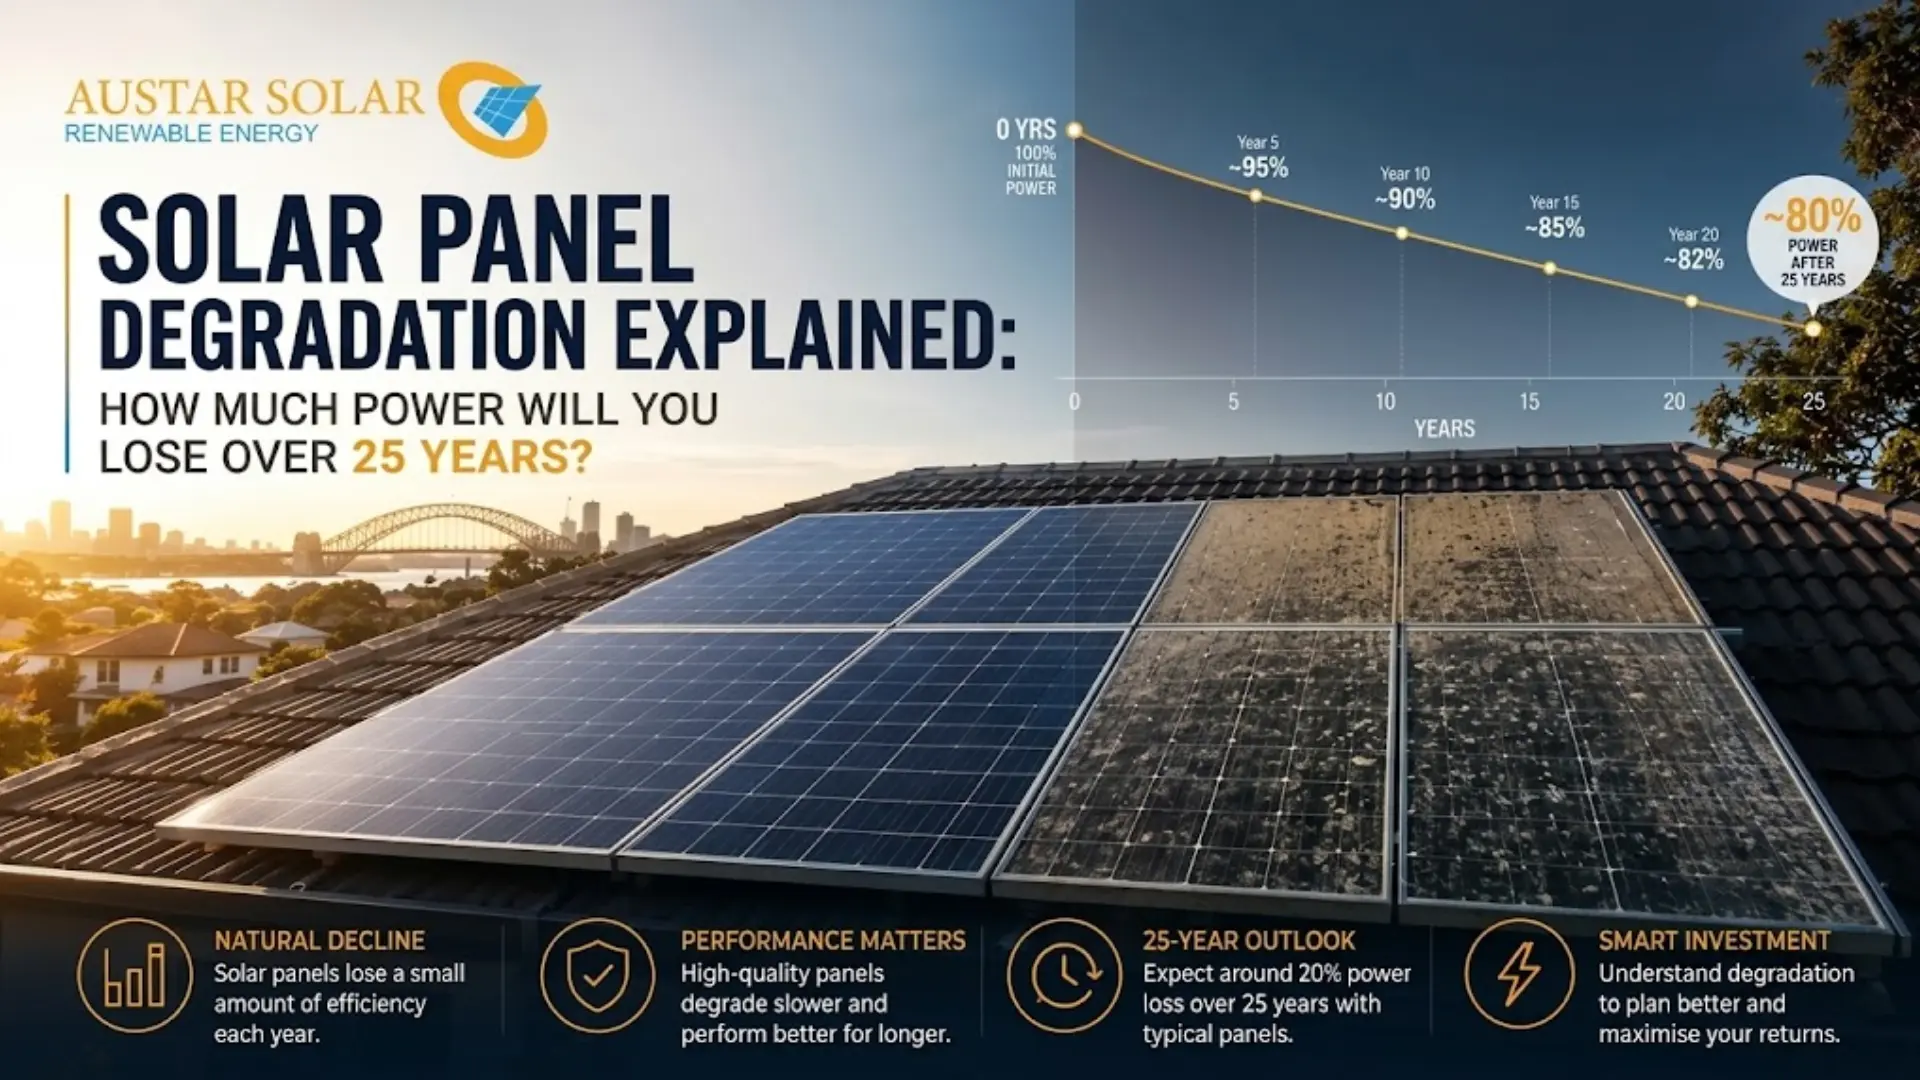
Solar panel degradation in Australia is a normal, gradual process, not a sign of failure. Panels lose a small percentage of their power output every year due to sun exposure, heat, and natural wear on the cells. Quality panels typically lose 0.3% to 0.6% of output per year, retaining 85–90% of their original power after 25 years.
Premium brands like REC and SunPower Maxeon degrade more slowly, around 0.25–0.30% annually, while budget panels can lose closer to 0.9% per year. A well-installed 6.6kW system still produces strong output after two decades — just slightly less than on day one.
Understanding degradation rates helps you calculate real lifetime savings, compare panel brands, and choose the right system for 25–30 years of reliable performance.
What Is Solar Panel Degradation?
Solar panel degradation is the gradual loss of a panel’s ability to produce electricity over time. It’s caused by long-term exposure to strong sunlight, heat, changing weather, moisture, and normal material aging.
Most quality panels installed in Australia lose about 0.3% to 0.6% of their output each year under manufacturer testing conditions — meaning a panel can still produce around 85–90% of its original output after 25 years. Regular cleaning, correct installation, and choosing Tier One panels all help keep degradation on the lower end of that range.
What Causes Solar Panels to Degrade?
Solar panels degrade due to sustained UV exposure, high temperatures, extreme weather, and the natural aging of the materials within the module. Here’s what drives each factor:
- Strong UV exposure — Australia receives high levels of ultraviolet radiation, which slowly breaks down the protective materials on the panel surface, reducing efficiency over many years.
- High temperatures — Repeated expansion and contraction from hot weather stresses internal cells and electrical connections, causing gradual performance loss.
- Extreme weather — Hail, wind, and storms can crack the panel surface or frame; even hairline cracks can let in moisture and reduce output.
- Moisture and humidity — If a panel’s seal weakens, water ingress can corrode internal components and accelerate power loss.
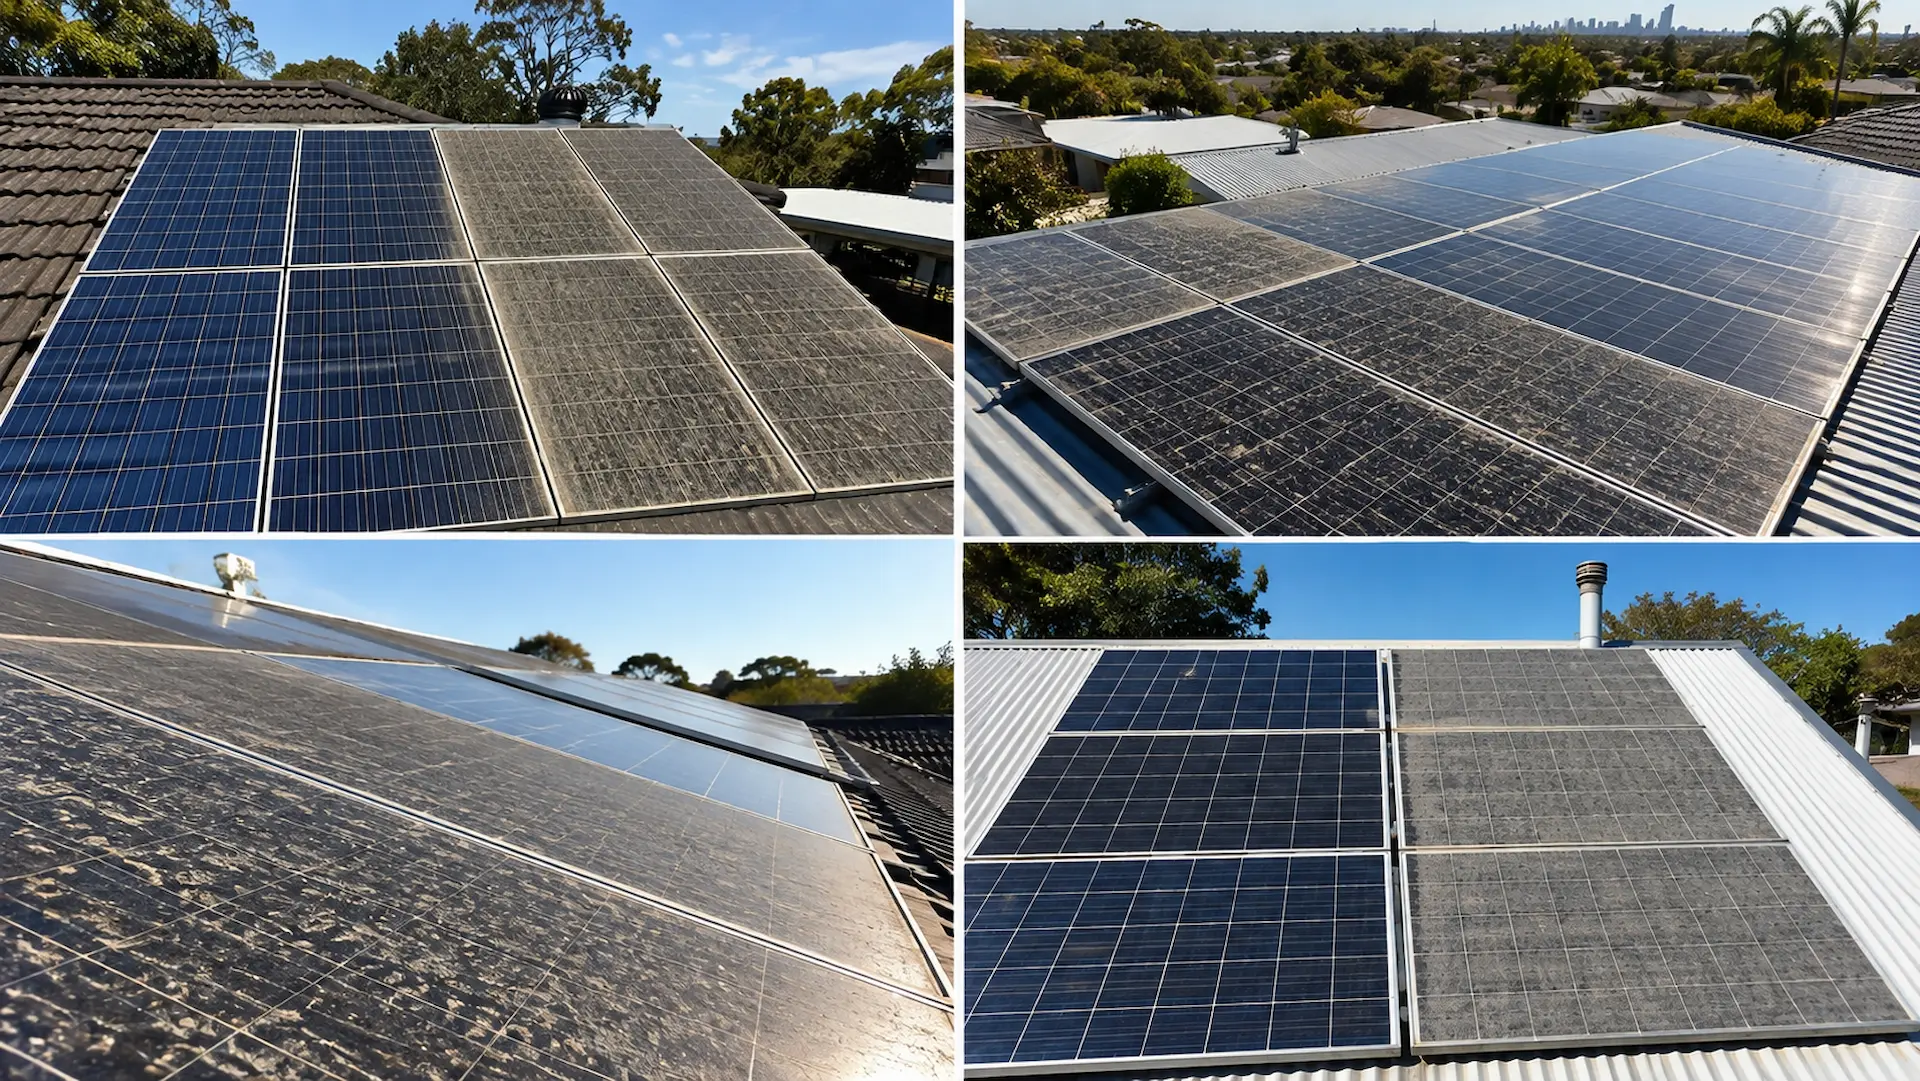
- Dust, dirt, and debris — Dust, leaves, and bird droppings block sunlight from reaching the cells; regular cleaning keeps this in check.
- Natural aging — All panels lose some efficiency due to material aging, which is expected and factored into manufacturers’ performance warranties.
How Long Do Solar Panels Last? Lifespan & Degradation by Tier
A quality solar panel lasts 25–30 years. Panels don’t stop working at the end of this period — they simply produce less power, so most systems keep generating usable electricity well beyond their warranty term.
| Panel Grade | Degradation Rate/Year | Expected Lifespan | Output at End of Life |
| Premium (REC, SunPower Maxeon) | 0.25%–0.30% | 30 years | ~91–93% |
| Tier One (current mono-PERC) | 0.35%–0.40% | 25–30 years | ~87–90% |
| Average/mid-range panel | 0.5%–0.6% | 25 years | ~85–88% |
| Tier Two | ~0.5% | 20–25 years | ~85% |
| Tier Three / budget | 0.7%–0.9% | 15–20 years | ~78–82% |
These are manufacturer-rated figures based on standard testing conditions. Real-world performance can differ — see below.
🎥 Want to see how solar panel degradation affects performance over time? Watch our video, “Solar Panel Degradation in Australia: How to Slow Power Loss Over 25 Years,” for a clear visual breakdown of what to expect from your solar system.
Real-World Performance Data: What the Research Actually Shows
Manufacturer warranty figures assume steady, predictable degradation. Real-world field data tells a more nuanced story — and the numbers vary depending on whether you’re looking at a typical well-installed panel or the full spread across the market, including underperforming outliers.
A 2026 study from UNSW analysed nearly 11,000 photovoltaic systems worldwide and found that the average system loses about 0.9% of output per year — noticeably higher than the 0.3–0.6% typically quoted for premium and Tier One panels under lab/warranty conditions. The gap is explained by a “long tail” in the data: up to 20% of panels degrade at least 1.5 times faster than average, and around one in 12 degrade twice as fast, dragging the overall average upward. For the worst-affected systems, this can mean losing around 45% of output by the 25-year mark, or reaching end-of-life in as little as 11 years.
Importantly, the causes identified weren’t primarily climate-driven. The UNSW research pointed to manufacturing defects, interconnected component failures, and minor flaws that worsen gradually before causing sudden performance loss — meaning the “long tail” risk shows up regardless of climate, though harsh conditions can still make it worse.
What this means practically: the 0.3–0.6% figures on spec sheets are a reasonable expectation for a well-made, well-installed system, and most modern rooftop installations do land in that range — but they’re a best case, not a guarantee. The market-wide average is pulled higher by a minority of poorly-made or poorly-installed panels. Choosing Tier One or premium panels and a qualified installer meaningfully reduces your odds of landing in that faster-degrading minority.
| Data Point | Finding | Source |
| Global average field degradation (all panels, all quality tiers) | ~0.9%/year across ~11,000 systems studied | UNSW |
| Panels degrading faster than expected (“long tail”) | Up to 20% degrade at least 1.5x faster than average; ~1 in 12 degrade twice as fast | UNSW |
| Worst-case real-world lifespan impact | Useful life can drop from 25 years to as little as 11 years for affected panels | UNSW |
| Typical modern rooftop panel, real-world range | 0.3%–0.6%/year for most well-installed modern panels | Arka360 |
| Output after 10 years (typical) | 94–97% of original output | Arka360 |
| Output after 15 years (typical) | Above 90% of original output | Arka360 |
| Fixed-tilt systems, UV-driven degradation | Approximately 0.25%/year | pv magazine Australia |
| Tracker-mounted (SAT) systems, UV-driven degradation | Up to 0.35%/year | pv magazine Australia |
| Primary cause of unexpected/accelerated failures | Latent manufacturing defects, not strongly linked to climate exposure | UNSW |
Factors That Affect Your Panels’ Actual Lifespan
Panel quality — Tier One and premium panels use better materials and tighter manufacturing tolerances, so they degrade more slowly than budget alternatives.
Climate and heat — Australia’s intense UV and heat accelerate wear. Panels in hotter regions like Darwin or Perth tend to degrade faster than those in cooler climates.
Installation standards — Poor mounting, incorrect wiring, or bad panel angles cause uneven stress and hot spots, leading to earlier-than-expected failure. This is why choosing a CEC-accredited installer matters as much as the panel brand itself.
Maintenance and cleaning — Dust and debris block sunlight and can create hot spots; cleaning every 6–12 months keeps panels performing efficiently.
Weather exposure — Hail and temperature swings can cause micro-cracks that worsen over time.
Inverter lifespan — Inverters typically last 10–15 years, shorter than panels. A failing inverter can limit real-world system output even when the panels themselves are fine.
How to Calculate Your Total Lifetime Savings
Degradation reduces output slightly each year, which affects your total savings over the life of the system.
Basic formula:
Annual Output = Rated Output × (1 − Degradation Rate) ^ Number of Years
Savings = Annual Output × Electricity Rate
Step by step:
- Start with your system’s rated output (e.g., 6.6kW)
- Apply your panel’s degradation rate (e.g., 0.5% per year)
- Calculate output for each year using the formula above
- Multiply yearly output by your electricity price for yearly savings
- Add up all years for total lifetime savings
Quick estimate: average output loss over 25 years for a quality system is typically 10–15%. Multiply your first-year savings by 25, then subtract roughly 12% to account for degradation, for a rough lifetime total.
Also factor in rising electricity prices, feed-in tariff changes, and one inverter replacement over a 25-year system life.
Example: 6.6kW system, Trina Vertex S+ 440W panels
Assumptions (adjust for the actual quote/site):
- 15 × Trina Vertex S+ 440W panels = 6.6kW system
- Day-1 rated annual output: ~9,500 kWh/year (typical for a well-oriented 6.6kW system in most of Australia — varies by location, tilt, and shading)
- Electricity rate: $0.30/kWh (adjust to the customer’s actual tariff)
- Degradation: −1% in year 1, then −0.4% every year after (Trina’s actual warranty terms)
Applying the formula:
Year 1 Output = 9,500 × (1 − 0.01) = 9,405 kWh
Year n Output = 9,405 × (1 − 0.004)^(n − 1) for n ≥ 1
| Year | Output vs Day 1 | Annual Output (kWh) | Annual Savings @ $0.30/kWh |
| 1 | 99.0% | 9,405 | $2,822 |
| 5 | 97.4% | 9,253 | $2,776 |
| 10 | 95.5% | 9,072 | $2,722 |
| 15 | 93.6% | 8,892 | $2,668 |
| 20 | 91.7% | 8,712 | $2,614 |
| 25 | 89.9% | 8,541 | $2,562 |
That 89.9% at year 25 lines up almost exactly with Trina’s own published figure for the Vertex S+ (~89% of Day 1 output after 25 years) — good sign the formula is being applied correctly.
Rough lifetime total: averaging the output decline across the full 25 years (roughly a 5% average loss relative to Day 1) gives approximate lifetime production of ~225,500 kWh, or about $67,650 in electricity savings at a flat $0.30/kWh — before accounting for rising electricity prices, which would push the real number higher, or any feed-in tariff income on exported power.
Caveat worth keeping in the article or quote: this uses Trina’s warranty-guaranteed rate, which is the conservative floor, not necessarily the panel’s real-world average — Trina’s own marketing cites 0.4%/year as the actual expected rate (excluding the year-1 step), so real performance likely lands a bit above this table, not below it.
Tips to Maximise Solar Panel Lifespan & Minimise Degradation
Before installation: choose Tier One or premium panels from established brands; use a CEC-accredited installer for correct mounting and wiring; ensure proper ventilation behind the panels to reduce heat buildup.
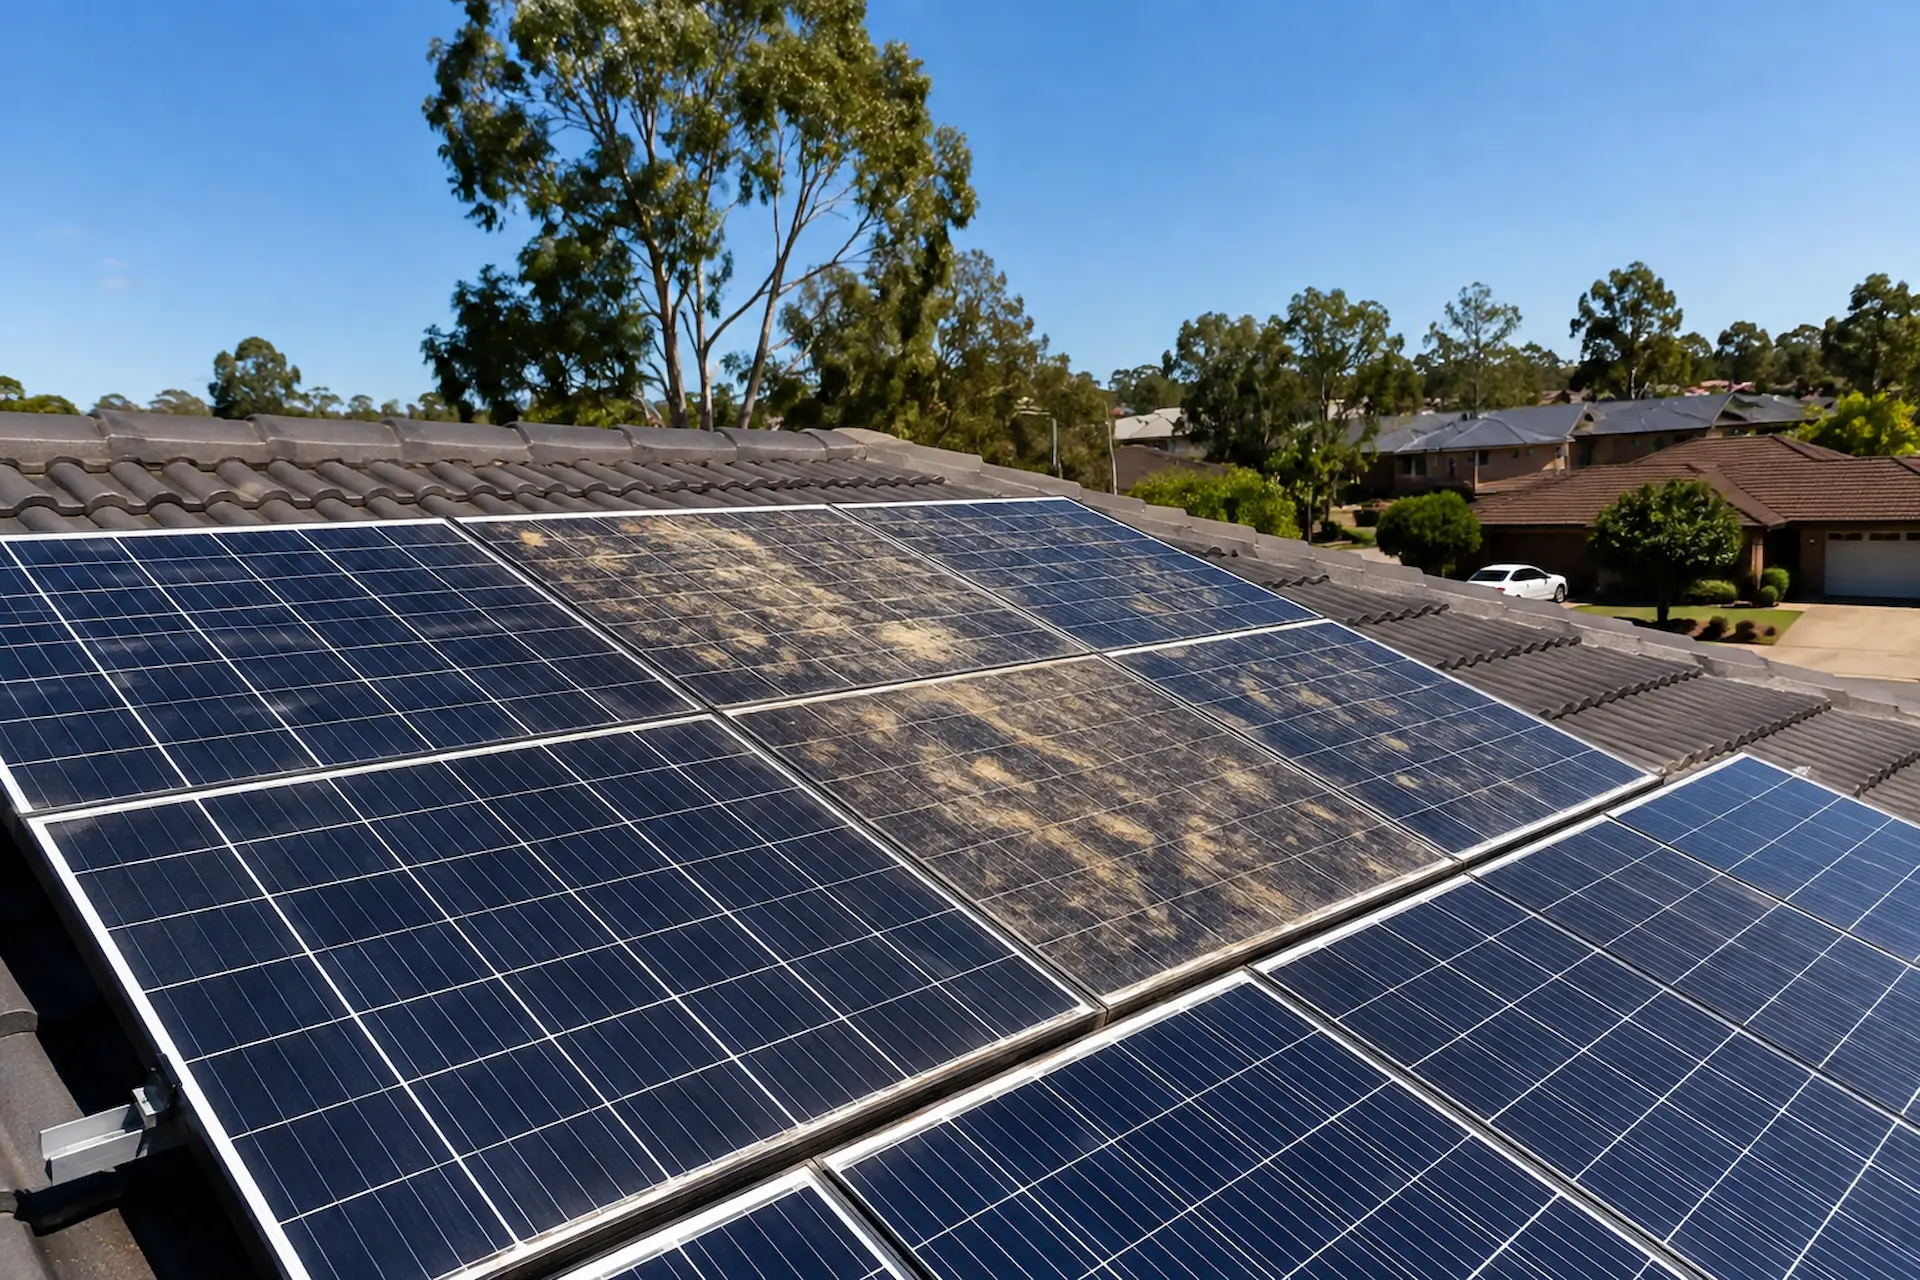
Ongoing maintenance: clean panels every 6 –12 months; schedule professional inspections every 1 – 2 years; check for cracks, discolouration, or loose wiring.
System care: use quality inverters and connectors; ensure correct grounding to prevent potential-induced degradation (PID); monitor output through an app to catch performance drops early.
Environmental protection: trim overhanging branches to reduce shading and debris; avoid walking on panels to prevent micro-cracks.
Catching small issues early — a loose rack, a hairline crack — prevents the kind of cascading failure behind the “long tail” cases in the UNSW research.
Solar Panel Warranties in Australia: What They Actually Cover
Panels come with two separate warranties, and it’s easy to confuse them.
Product warranty covers manufacturing defects — faulty materials or workmanship — usually for 10–15 years, though some premium brands extend to 25 years.
Performance warranty guarantees panels won’t lose power faster than a set rate, typically for 25–30 years, promising a minimum output (often 80–90% of original capacity by the end of the term).
- Product warranty: cracked glass, delamination, faulty wiring, frame defects
- Performance warranty: minimum guaranteed output over time, not physical damage
- Installer warranty: separate cover for workmanship, usually 5–10 years
- Inverter warranty: shorter, often 5–12 years
Popular Solar Panel Brands in Australia: Warranty Comparison
| Brand | Product Warranty | Performance Warranty | Notable Strength |
| REC (Alpha Pure / ProTrust) | 20 yrs standard; extends to 25 yrs with a REC Certified installer | 25 yrs (92% at year 25 on Alpha Pure) | ProTrust program is one of the few that also covers labour costs for a claim — most brands don’t |
| Trina Solar (Vertex S+) | Up to 25 yrs | Up to 30 yrs (87.4% floor) | Dual-glass N-type cells reduce backsheet/moisture-related failure modes |
| Jinko Solar | 10–12 yrs | 25 yrs | High global volume — administered in Australia via Jinko Solar Australia Holdings |
| LONGi Solar (Hi-MO series) | 12–15 yrs | 25 yrs | World’s largest monocrystalline wafer manufacturer; strong supply chain reliability |
| Canadian Solar | ~12 yrs on standard lines (check specific model) | Typically 25 yrs | Financially well-established Tier 1 manufacturer |
| Qcells (Q.TRON) | Up to 25 yrs | Up to 25 yrs | Strong 25-year coverage across the board |
| SunPower / Maxeon | Up to 40 yrs | 25 yrs+ | Longest product warranty on the Australian market |
| Risen Energy | 15 yrs (above the 10-year norm) | 25 yrs | Longer-than-standard product cover at a mid-range price point |
Note*Figures are typical/current at time of writing — always confirm against the exact datasheet for the specific model quoted, since terms vary by product line and change over time.
Hidden Warranty Loopholes to Watch For
- “Performance warranty” doesn’t mean “no degradation” — it means a guaranteed floor.
A 25-year, 87% performance warranty doesn’t promise steady, predictable decline — it promises the panel won’t fall below 87% by year 25. A panel can degrade unevenly, or sit right at the line, and still be technically “within warranty” even if a homeowner assumed near-zero loss. - Independent installation can void a vertically-integrated manufacturer’s warranty.
Some manufacturers only honour the full warranty terms when installation is done by their own certified network. Research on PV warranty enforceability notes that with vertically integrated manufacturers, installing outside their approved network can invalidate the warranty entirely — even if the panel itself isn’t at fault. This is exactly why REC’s ProTrust (and similar programs from other brands) require a certified installer for the extended terms — it’s not just a marketing upsell, it’s often the difference between a valid and voided claim. - Freight and labour costs are usually not included — unless explicitly stated.
Most manufacturer warranties cover the panel itself, not the cost of removing a faulty one, shipping it back, or reinstalling a replacement. REC’s ProTrust is a rare exception that folds labour into the extended warranty; with most other brands, that cost falls to the homeowner or installer unless a separate labour/workmanship warranty (usually 5–10 years, provided by the installer, not the panel manufacturer) covers it. - “Send it back to the manufacturer” is often impractical by design.
Since most panels sold in Australia are manufactured overseas, Australian consumer law places responsibility for the manufacturer’s warranty on the local importer, because shipping panels back to the country of manufacture generally isn’t practical. Some manufacturers cover this with prepaid warranty insurance; others charge extra for broader coverage — worth checking which applies before assuming the headline warranty period is fully backed. - Brand exits and “orphaned” warranties.
If an overseas manufacturer or importer exits the Australian market or goes insolvent, a homeowner can be left holding a warranty with no one to claim against. This is a real risk with lower-tier brands that don’t have an established local presence. Importantly, though — this doesn’t leave the homeowner with nothing: Australian Consumer Law protections apply on top of any manufacturer warranty and generally survive even if the manufacturer has exited the market or become uncontactable, meaning the retailer/installer that took the payment typically still carries responsibility. This is a genuine reason to weigh installer reputation and brand longevity, not just warranty length on paper. - Registration and paperwork deadlines.
Some warranties require product registration within a set window after installation, and most require proof of purchase, installation certificates, and CEC-accredited installation to remain valid. Skipping this step is a common — and entirely avoidable — reason claims get denied later.
Warranties don’t cover storm damage, hail, or accidental breakage — that’s what home insurance is for. Always check the fine print before buying.
Conclusion
Solar panel degradation is a natural and gradual process that shouldn’t discourage homeowners from investing in solar. High-quality solar panels typically lose only 0.3% to 0.6% of their power output each year, allowing them to retain around 85–90% of their original performance after 25 years. While most well-manufactured systems perform within this range, lower-quality products or poor installation practices can lead to faster degradation over time.
To maximise the lifespan and performance of your solar investment, choose reputable Tier 1 solar panels, work with a CEC-accredited installer, and schedule regular system inspections and panel cleaning. These simple steps can help ensure your system delivers reliable energy savings for decades.
If you’re considering upgrading to premium solar panels or want to assess the condition of your existing system, Austar Solar is here to help. Our CEC-accredited team can recommend the right solution for your home and ensure your solar system continues performing at its best for years to come. Contact us today for a free, no-obligation quote.
FAQs on Solar Panel Degradation Australia
Do solar panels degrade in storage?
Not significantly, if stored in a dry, cool, protected place. Poor storage conditions or physical damage can reduce performance before installation.
Do solar panels degrade when not in use?
No — degradation comes from sunlight, heat, weather, and aging, not from sitting idle or disconnected.
How much do solar panels degrade each year?
Most quality panels degrade 0.3% to 0.6% per year under standard conditions, though real-world field data shows a global average closer to 0.9%, with a minority of panels degrading significantly faster.
How much do solar panels degrade over time?
Over 25 years, most quality panels lose 10–15% of their original output, retaining 85–90% of initial capacity.
Which type of solar panels degrade over time?
All panel types degrade — monocrystalline, polycrystalline, and thin-film. High-quality monocrystalline panels typically have the lowest degradation rates and longest expected lifespan.